DECEMBER KEY FIGURES
 | Sep Qtr 09 to Dec Qtr 09 | Dec Qtr 08 to Dec Qtr 09 |
| STAGE OF PRODUCTION | % change | % change |
|
| Final (Stage 3) commodities (excl. exports) | -0.4 | -1.5 |
| Domestic | 0.3 | 0.2 |
| Imports | -5.2 | -12.0 |
| Intermediate (Stage 2) commodities | -0.9 | -6.5 |
| Domestic | -0.4 | -4.3 |
| Imports | -3.9 | -19.6 |
| Preliminary (Stage 1) commodities | -0.8 | -8.4 |
| Domestic | -0.3 | -5.8 |
| Imports | -3.2 | -23.0 |
|
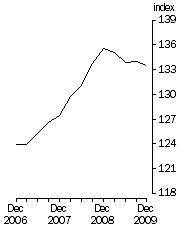
Final Stage, Base 1998-99 = 100.0

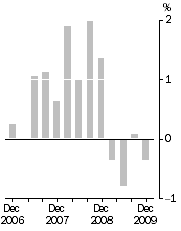
| Final Stage, Quarterly % change

|
DECEMBER KEY POINTS
FINAL (STAGE 3) COMMODITIES
- decreased by 0.4% in the December quarter 2009.
- mainly due to price decreases in petroleum refining (-6.9%), electronic equipment manufacturing (-9.1%) and industrial machinery and equipment manufacturing (-2.5%).
- partially offset by price increases in other agriculture (+11.2%) and building construction (+0.3%).
- decreased by 1.5% through the year to December quarter 2009.
INTERMEDIATE (STAGE 2) COMMODITIES
- decreased by 0.9% in the December quarter 2009.
- mainly due to price decreases in grain, sheep, beef and dairy cattle farming (-7.2%), iron and steel manufacturing (--6.6%) and petroleum refining (-3.6%).
- partially offset by price increases in oil and gas extraction (+3.0%), metal ore mining (+4.0%) and electricity, gas and water supply (+1.8%).
- decreased by 6.5% through the year to December quarter 2009.
PRELIMINARY (STAGE 1) COMMODITIES
- decreased by 0.8% in the December quarter 2009.
- mainly due to price decreases in iron and steel manufacturing (-6.7%), grain, sheep, beef and dairy cattle farming (-6.2%), basic chemical manufacturing (-5.1%) and petroleum refining (-3.4%).
- partially offset by price increases in oil and gas extraction (+3.0%), electricity, gas and water supply (+1.9%) and services to transport (+4.5%).
- decreased by 8.4% through the year to December quarter 2009.
NOTES
FORTHCOMING ISSUES
| ISSUE (QUARTER) | Release Date |
| March 2010 | 27 April 2010 |
| June 2010 | 26 July 2010 |
| September 2010 | 25 October 2010 |
| December 2010 | 24 January 2011 |
ROUNDING
Any discrepancies between totals and sums of components are due to rounding.
DATA REFERENCES
Data referenced in the Key Points and Commentary are available from the tables shown in this publication, or in the corresponding tables of this publication on the ABS website <
https://www.abs.gov.au>.
INQUIRIES
For further information about these and related statistics, contact the National Information and Referral Service on 1300 135 070.
SUMMARY COMMENTARY
COMMENTARY
Links to Other Parts of This Release
To access the "Commentary" page use this link
Commentary
To access the "Price Indexes and Contract Price Indexation" page use this link
Price Indexes and Contract Price Indexation
 Print Page
 Print All